grafana-ui教程
目录
简介
grafana-ui 是 grafana 公司的 UI 展示组件.
安装
服务安装
参考官网 Install Grafana on Debian or Ubuntu | Grafana documentation,这个下载很慢, 建议挂上 apt代理
# 安装必要的包和签名key
apt install -y apt-transport-https software-properties-common wget
wget -q -O /usr/share/keyrings/grafana.key https://apt.grafana.com/gpg.key
# 添加repo
echo "deb [signed-by=/usr/share/keyrings/grafana.key] https://apt.grafana.com stable main" | sudo tee -a /etc/apt/sources.list.d/grafana.list

# 清华源
echo "deb [signed-by=/usr/share/keyrings/grafana.key] https://mirrors.tuna.tsinghua.edu.cn/grafana/apt/ stable main" | sudo tee -a /etc/apt/sources.list.d/grafana.list
# 阿里源
echo "deb https://mirrors.aliyun.com/grafana/debian stable main" | sudo tee -a /etc/apt/sources.list.d/grafana.list

# 安装, grafana-enterprise是企业版
apt update -y; apt install grafana -y

# 启动
systemctl enable grafana-server --now
# 默认密码 admin/admin
curl 127.0.0.1:3000
nginx 配置
配置 nginx 转发访问
server {
    listen 80;
    server_name om-grafana.kentxxq.com;
    return 301 https://$server_name$request_uri;
    access_log /usr/local/nginx/conf/hosts/logs/om-grafana.kentxxq.com.log k-json;
}

server {
    http2 on;
    listen 443 ssl;
    server_name om-grafana.kentxxq.com;
    access_log /usr/local/nginx/conf/hosts/logs/om-grafana.kentxxq.com.log k-json;

    include /usr/local/nginx/conf/options/normal.conf;
    include /usr/local/nginx/conf/options/ssl_kentxxq.conf;

    location / {
        proxy_pass http://127.0.0.1:3000;
    }
}
配置 explore 关联
日志关联 trace
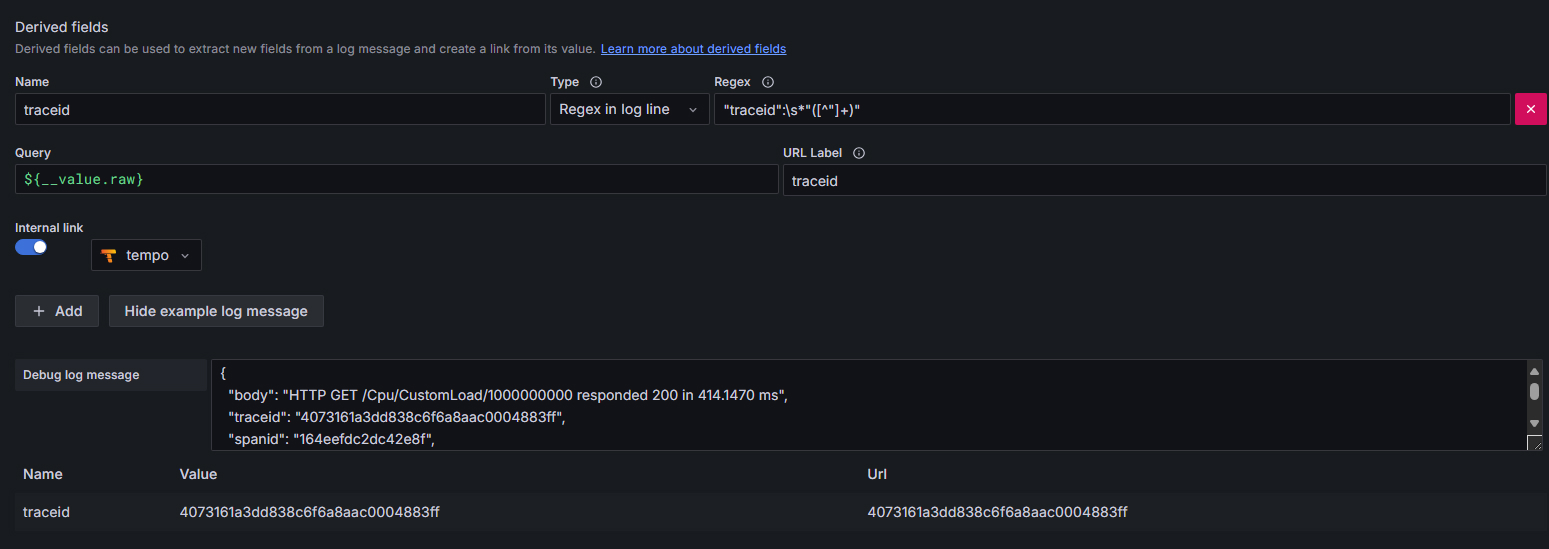
- 日志是 json 格式
- 用 regex 提取里面的 traceid 字段
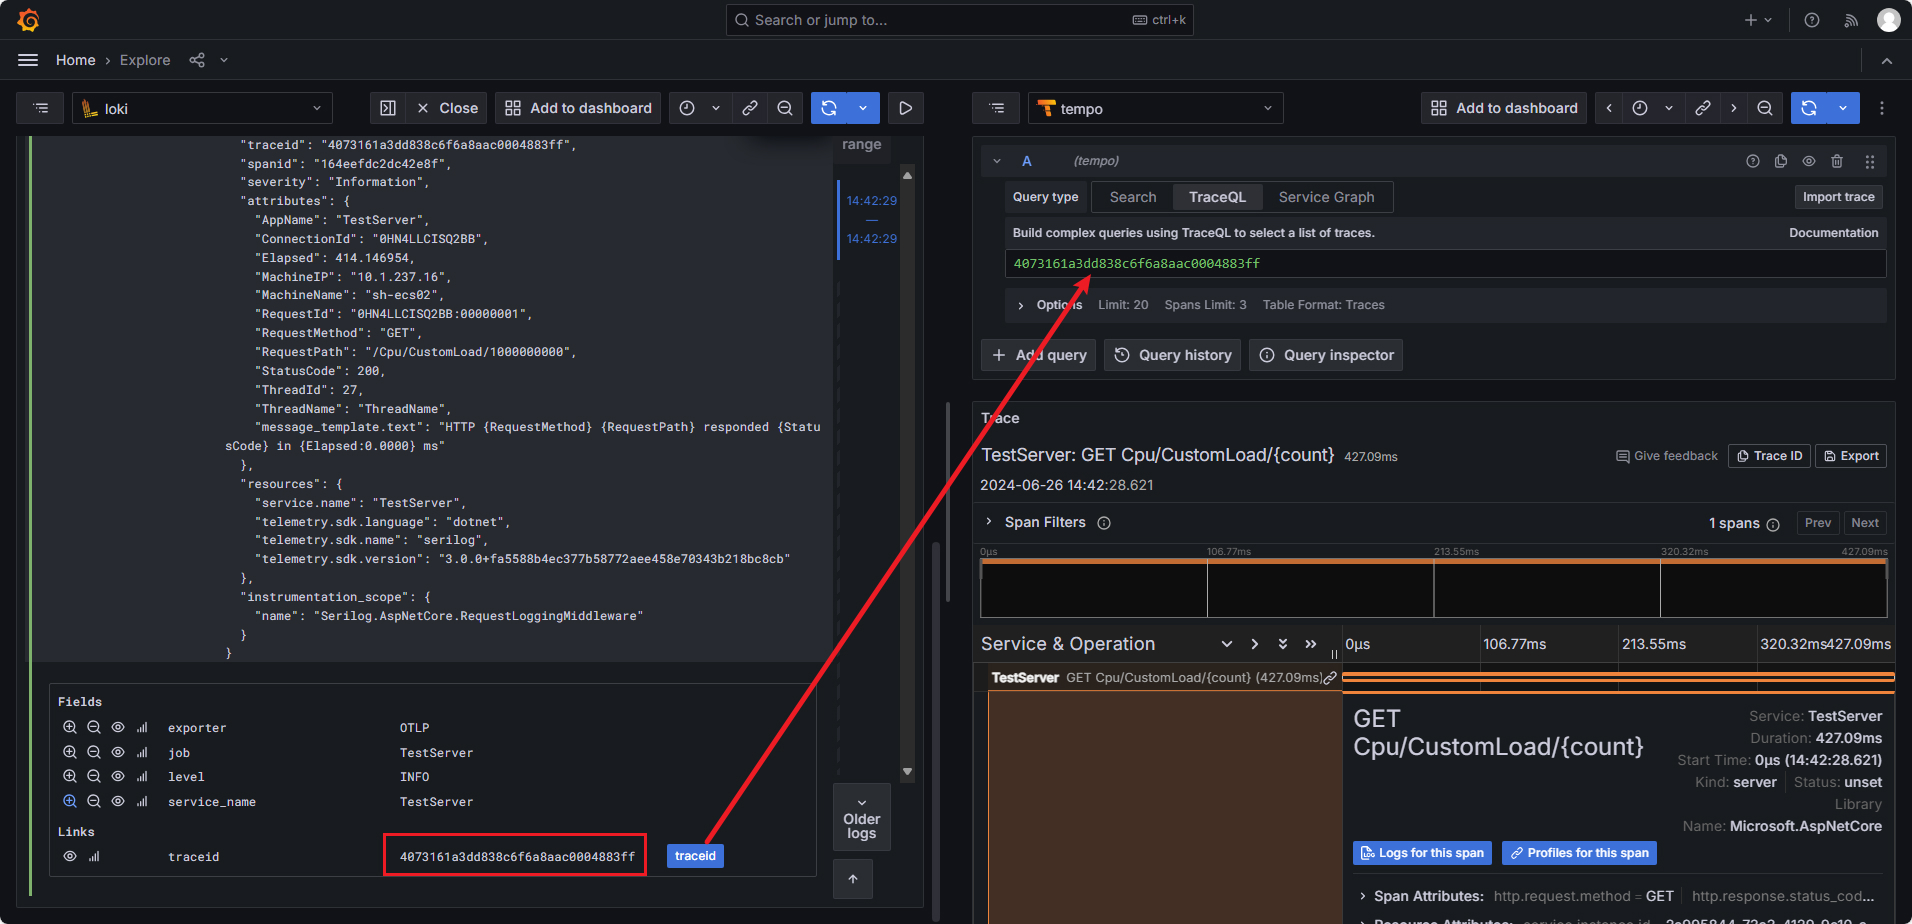
trace 关联 ALL
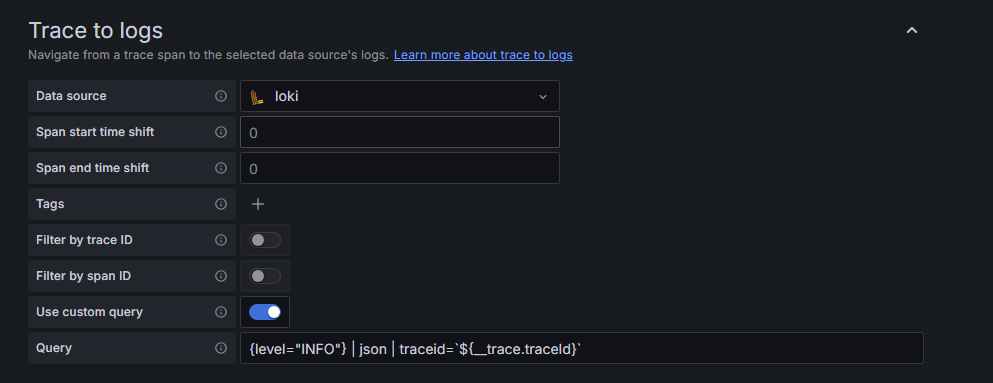
trace 关联 log
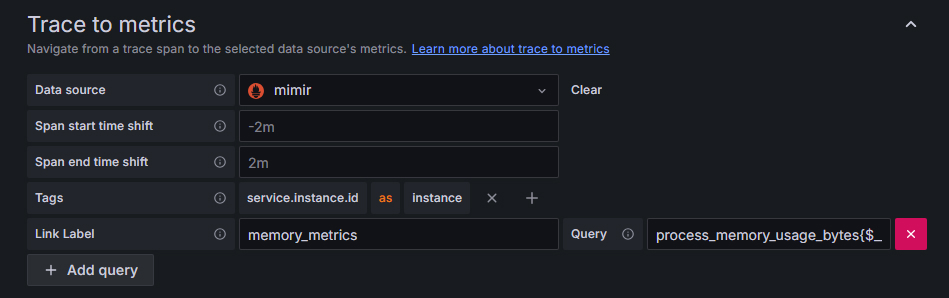
trace 关联 metrics
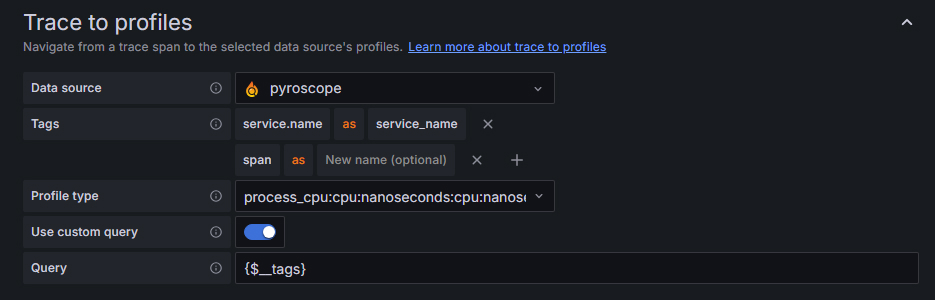
trace 关联 profiles
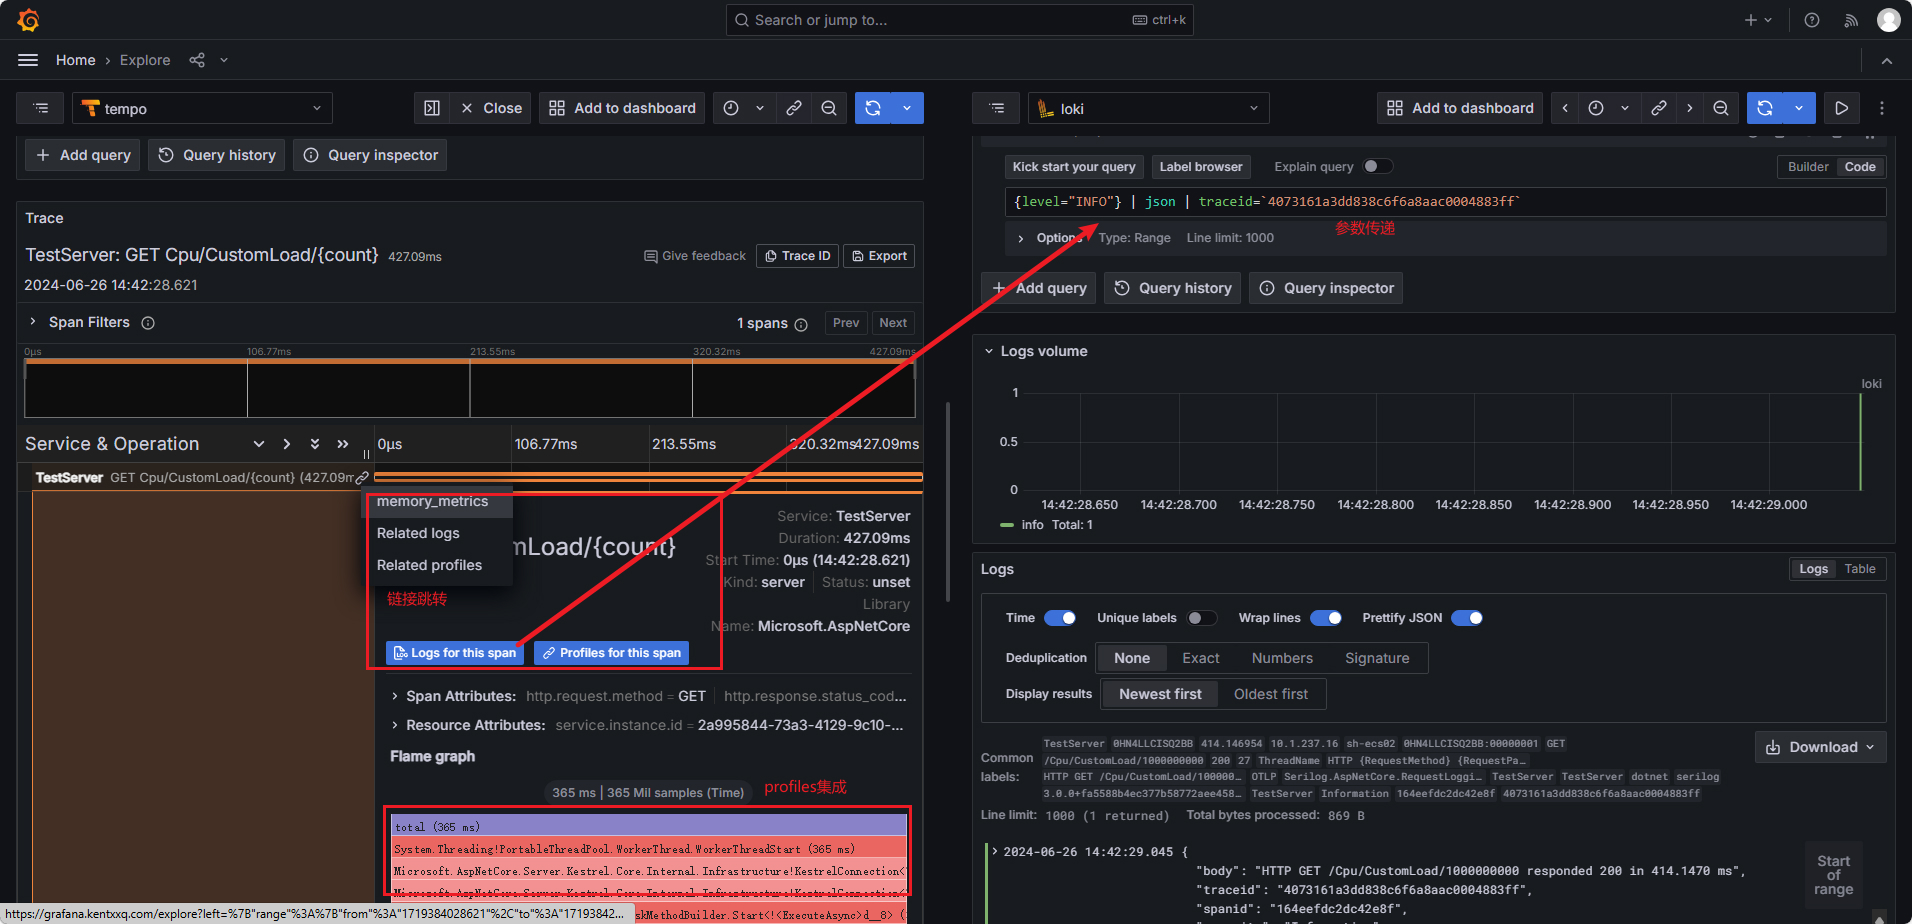
效果图
相关文档
查询
查询类型
vector一个时刻的结果 instant querymatrix一段时间的结果 range query
数据类型
gauge 当前值会上下浮动.
内存使用率符合场景.
# TYPE process_memory_usage_bytes gauge
# UNIT process_memory_usage_bytes bytes
# HELP process_memory_usage_bytes The amount of physical memory in use.
process_memory_usage_bytes{otel_scope_name="OpenTelemetry.Instrumentation.Process"} 189915136 1719480893337
counter 计数器, 只增不减.
- gc 次数统计符合场景
- 通过不同的 label, 区别不同级别的 gc
# TYPE process_runtime_dotnet_gc_collections_count_total counter
# HELP process_runtime_dotnet_gc_collections_count_total Number of garbage collections that have occurred since process start.
process_runtime_dotnet_gc_collections_count_total{generation="gen2"} 3 1719480893337
process_runtime_dotnet_gc_collections_count_total{generation="gen1"} 1 1719480893337
process_runtime_dotnet_gc_collections_count_total{generation="gen0"} 4 1719480893337
histogram 直方图. 例如 tcp连接慢于xx秒的分段统计
- 反应不同区间内样本的个数. 使用
le区分样本. 下面是连接耗时少于0.01,0.02秒的连接统计 - 有
_count计算当前样本总数 - 有
_sum计算历史总量
# TYPE kestrel_connection_duration_seconds histogram
# UNIT kestrel_connection_duration_seconds seconds
# HELP kestrel_connection_duration_seconds The duration of connections on the server.
kestrel_connection_duration_seconds_bucket{server_port="4100",le="0.01"} 29 1719480893337
kestrel_connection_duration_seconds_bucket{server_port="4100",le="0.02"} 32 1719480893337
kestrel_connection_duration_seconds_bucket{server_port="4100",le="0.05"} 33 1719480893337
kestrel_connection_duration_seconds_bucket{server_port="4100",le="0.1"} 33 1719480893337
kestrel_connection_duration_seconds_bucket{server_port="4100",le="0.2"} 35 1719480893337
kestrel_connection_duration_seconds_bucket{server_port="4100",le="0.5"} 35 1719480893337
kestrel_connection_duration_seconds_bucket{server_port="4100",le="1"} 35 1719480893337
kestrel_connection_duration_seconds_bucket{server_port="4100",le="2"} 35 1719480893337
kestrel_connection_duration_seconds_bucket{server_port="4100",le="5"} 35 1719480893337
kestrel_connection_duration_seconds_bucket{server_port="4100",le="10"} 35 1719480893337
kestrel_connection_duration_seconds_bucket{server_port="4100",le="30"} 35 1719480893337
kestrel_connection_duration_seconds_bucket{server_port="4100",le="60"} 35 1719480893337
kestrel_connection_duration_seconds_bucket{server_port="4100",le="120"} 35 1719480893337
kestrel_connection_duration_seconds_bucket{server_port="4100",le="300"} 35 1719480893337
kestrel_connection_duration_seconds_bucket{server_port="4100",le="+Inf"} 35 1719480893337
kestrel_connection_duration_seconds_sum{server_port="4100"} 0.3536911 1719480893337
kestrel_connection_duration_seconds_count{server_port="4100"} 35 1719480893337
summary 摘要. 类似 histogram, 场景是 xx%的请求都在xx秒内完成了
# HELP prometheus_tsdb_wal_fsync_duration_seconds Duration of WAL fsync.
# TYPE prometheus_tsdb_wal_fsync_duration_seconds summary
prometheus_tsdb_wal_fsync_duration_seconds{quantile="0.5"} 0.012352463
prometheus_tsdb_wal_fsync_duration_seconds{quantile="0.9"} 0.014458005
prometheus_tsdb_wal_fsync_duration_seconds{quantile="0.99"} 0.017316173
prometheus_tsdb_wal_fsync_duration_seconds_sum 2.888716127000002
prometheus_tsdb_wal_fsync_duration_seconds_count 216
查询语法
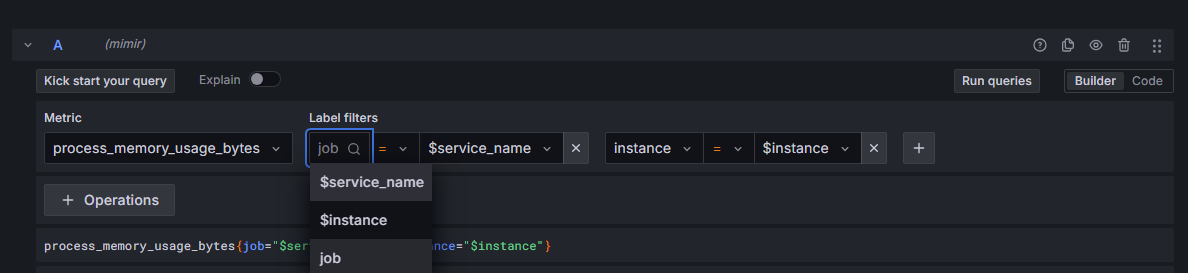
标签语法 - 特定实例
# 简单查询
http_requests_total{instance="localhost:9090"}
http_requests_total{instance!="localhost:9090"}
# 正则
http_requests_total{environment=~"staging|testing|development",method!="GET"}
时间范围查询 - 5 分钟内请求数
时间单位 s/m/h/d/w/y
# 5分钟内
http_requests_total{}[5m]
# 1天前,5分钟内
http_requests_total{}[5m] offset 1d
计算
# 内存使用率
# (总量-空闲)/总量
(memory_total - memory_free_total) / memory_total

# >
# 只要使用率大于90%的机器列表
(memory_total - memory_free_total) / memory_total > 0.90

# and
# 使用率>90%,和<10%的机器
(memory_total - memory_free_total) / memory_total > 0.90 and (memory_total - memory_free_total) / memory_total < 0.10
聚合分组 - 统计/平均/标签分组
# 查询系统所有http请求的总量
sum(http_request_total)

# 按照mode计算主机CPU的平均使用时间
avg(node_cpu) by (mode)
# without 用法
# 下面两句等价 http_requests_total{a=1,b=2,c=3}
sum(http_requests_total) without (a)
sum(http_requests_total) by (b,c)

# 按照主机查询各个主机的CPU使用率
sum(sum(irate(node_cpu{mode!='idle'}[5m]))  / sum(irate(node_cpu[5m]))) by (instance)
常用变量
- 参考此回答 - Stack Overflow
$__interval参数文档地址- Prometheus 会定期从您的应用程序中获取数据。Grafana 定期从 Prometheus 获取数据。Grafana 不知道 Prometheus 多久轮询一次您的应用程序以获取数据. Grafana 会自己去计算一个间隔时间.
- 计算方式
(to - from) / resolution - 假设我们查询范围是 1 小时, 而我们展示 60 个数据点, 那么
$__interval = 3600 / 60 = 60s
$__rate_interval参数文档地址- 当
$__interval是15s, 而 rate 至少需要 4 个数据点才能正常工作, 所以查询应该至少 1 分钟.$__rate_interval就是 grafana 经过计算后, 用来存放这个值的. 所以$__rate_interval = 1m The $__rate_interval variable is […] defined as max( $__interval + Scrape interval, 4 * Scrape interval)
- 当
$__range就是时间间隔. 比如你在 grafana 查询的时间间隔是6h, 所以$__range = 6h
常用函数
sum,min,max,avgtopk(5,http_requests_total),bottomkquantile(0.5, http_requests_total)样本中位数rate,irate返回增长量 (不是百分比)- 非常适合
counter只增不减, 所以需要计算增长速率 - 适合
histogram,因为它也是一个个独立的counter rate使用的注意点(last-first)/time只计算第一个和最后一个指标的差值, 然后除以秒数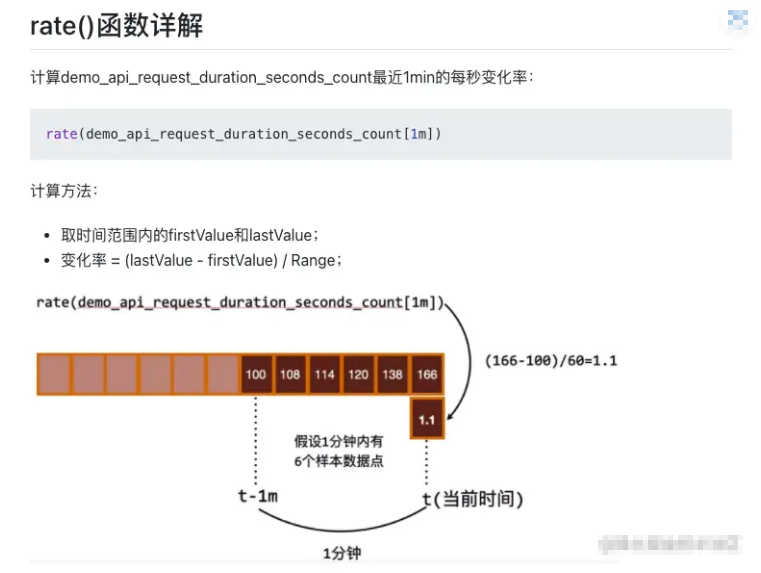
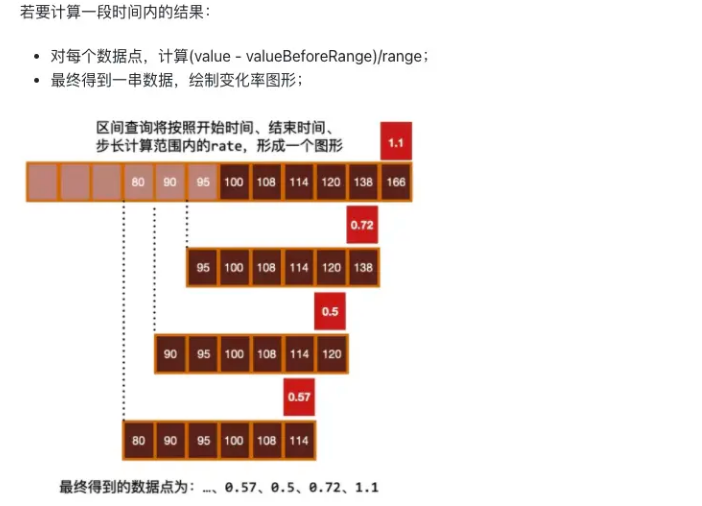
- 至少需要 4 个样本, 才能计算出来数据. 否则会 no data
irate只计算最后 2 个指标的差值. 变化更大, 毛刺更多.- 示例
- 每秒平均增长量. 观察长期趋势
rate(process_runtime_dotnet_thread_pool_completed_items_count_total[$__range]) - 顺时增长量,最后两个样本数据, 瞬时增长量
irate(process_runtime_dotnet_thread_pool_completed_items_count_total[$__range])
- 每秒平均增长量. 观察长期趋势
- 非常适合
- 根据
1天前的历史样本数据, 预测未来4个小时的值.predict_linear(process_runtime_dotnet_thread_pool_completed_items_count_total{}[1d], 4 * 3600) - 统计直方图
- 当前 (程序启动以来) 90% 的
dns解析都会在xx秒内完成histogram_quantile(0.9,dns_lookup_duration_seconds_bucket) - 计算特定时间内 (
$_range时间段), 90% 的dns解析都会在xx秒内完成histogram_quantile(0.90,sum(rate(dns_lookup_duration_seconds_bucket[$__range])) by (dns_question_name,le)) - 通常我们在查询的时候, 是想看最近这段时间. 而不是从程序启动以来的数据. 设想一下, 如果一个程序启动了 10 天, 你想看它启动以来所有请求比例吗? 如果你刚优化了程序, 效果会不明显, 因为会被历史记录平均掉. 而使用第二种方式你可以说缩短时间周期, 打到目的.
- 当前 (程序启动以来) 90% 的
综合示例
Pod 内存使用率
取每个容器的最大内存值 / requests 内存 * 100
(max(container_memory_working_set_bytes{namespace="default"}) by (pod) / sum(kube_pod_container_resource_requests_memory_bytes{namespace="default"}) by (pod)) * 100请求时间环比变化
# 环比增加与减少
sum (rate(prometheus_http_requests_total[1m] offset 1h ) ) -sum (rate(prometheus_http_requests_total[1m]))
status page 状态页
这里使用 blackbox 的采集数据作为示例
# 图形
time series
# unit
bool on/off
# 查询语句, Min step 1h
avg_over_time(probe_success{instance="https://www.qq.com/"}[1h])
最慢的 50 个接口
topk(50,
    max by (uri)
        (http_request_seconds{application="order-service", quantile="0.9"})
)
k8s 容器语句
pod 读写排序
读排序
topk(10,
  sum(rate(container_fs_reads_bytes_total[5m])) by (namespace, pod) / 1024 / 1024
)
写排序
topk(10,
  sum(rate(container_fs_writes_bytes_total[5m])) by (namespace, pod) / 1024 / 1024
)
cpu 百分比排序
sum(rate(container_cpu_usage_seconds_total{container!="POD"}[5m])) by (namespace, pod) * 100展示
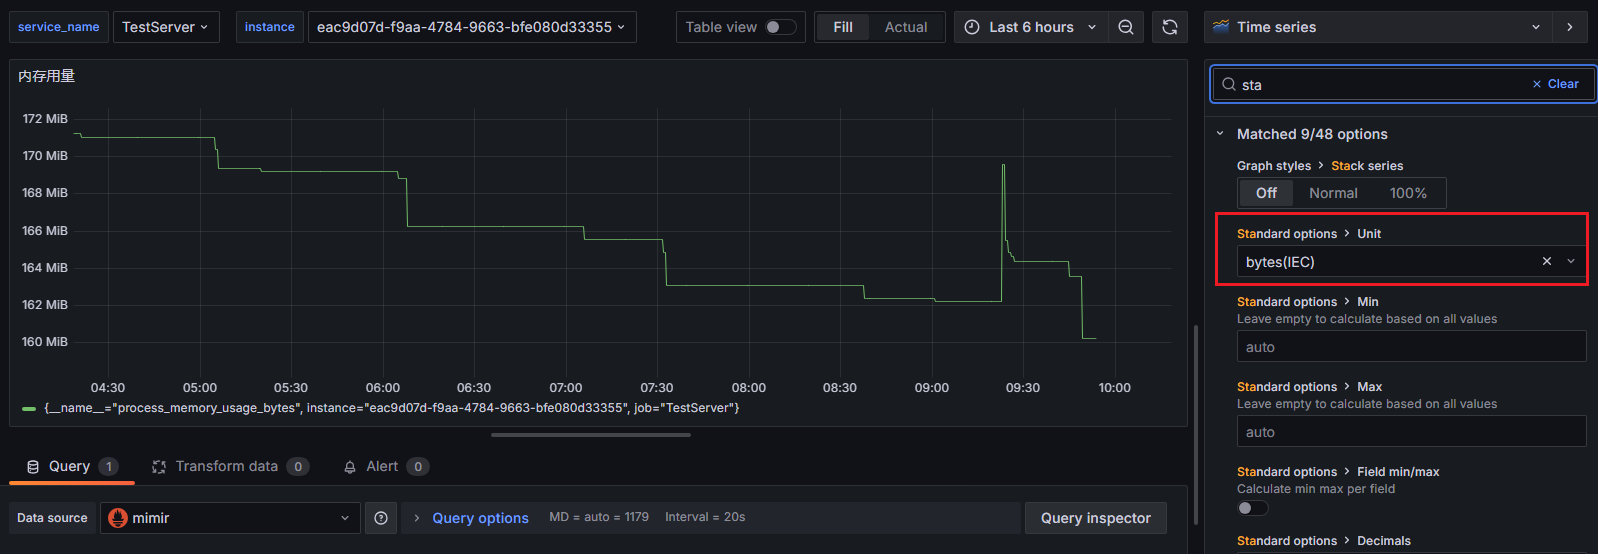
dashboard 全局参数
panel 类型选择
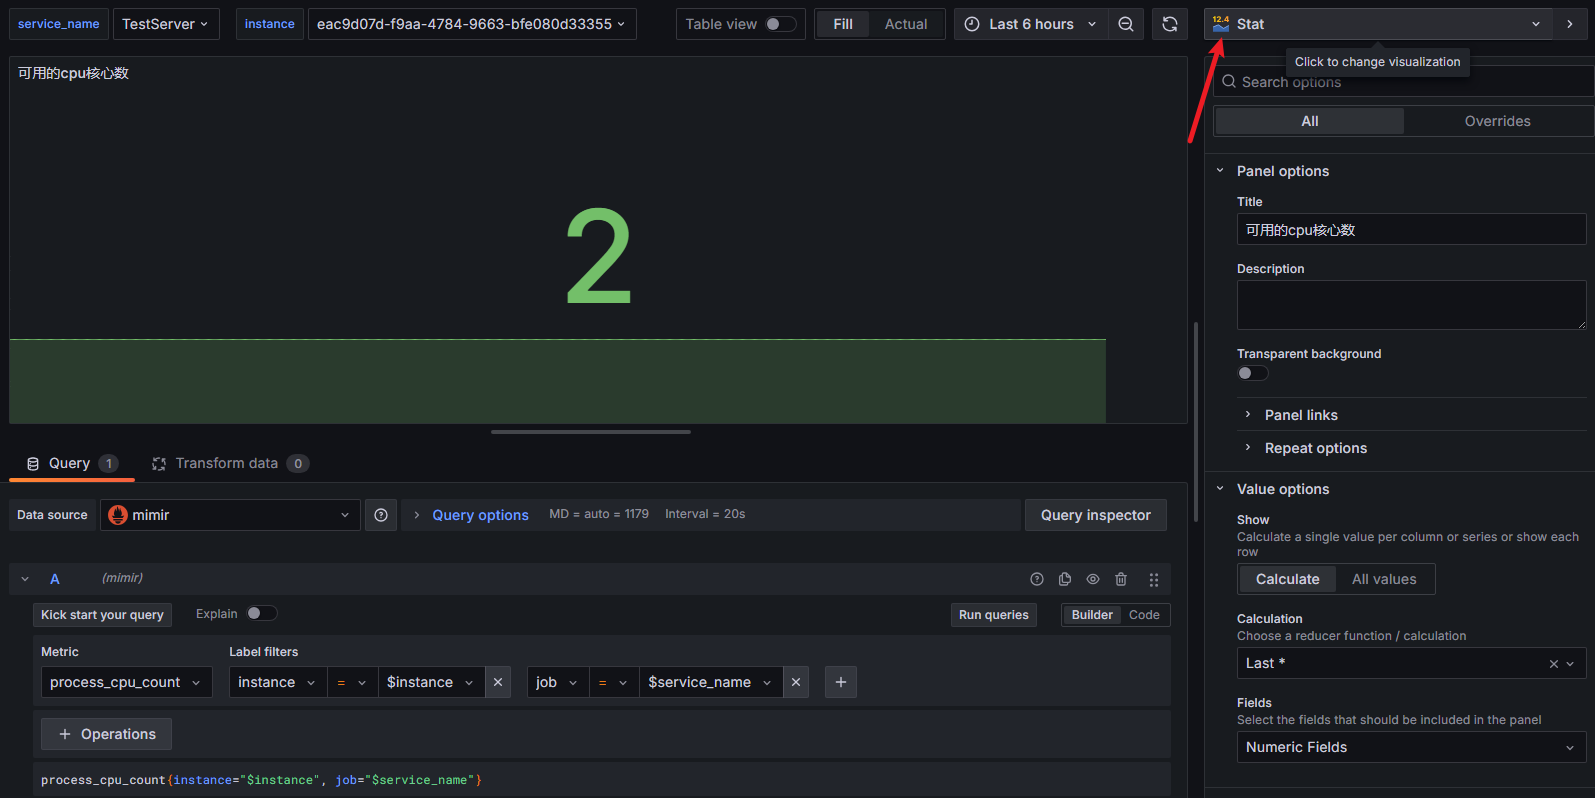
panel 数据单位
参考 dashboard
- .NET team Overview | Grafana Labs
- request 耗时 p50 p75 p90 p95 p99 p99.9 last min max
- OpenTelemetry dotnet webapi | Grafana Labs
- dotnet-monitor dashboard | Grafana Labs
- GitHub - nazarii-piontko/sample-dotnet-otel: Sample ASP.NET (.NET 8) project with OpenTelemetry integration
- 变化趋势:Graph面板 | prometheus中文手册
操作
重置密码
# 如果报错找不到默认配置 --homepath "/usr/share/grafana" <new_password>
grafana-cli admin reset-admin-password <new password>